Short answer: LangSmith is the most complete LLM observability platform if you build with LangChain: tracing, evaluations, prompt management and monitoring in one product. Langfuse is the leading open-source option: MIT-licensed, free to self-host, and framework-agnostic. If your agents run on a platform that already traces every run (DNotifier does), you may only need that built-in tracing at first, and add an evals tool later.
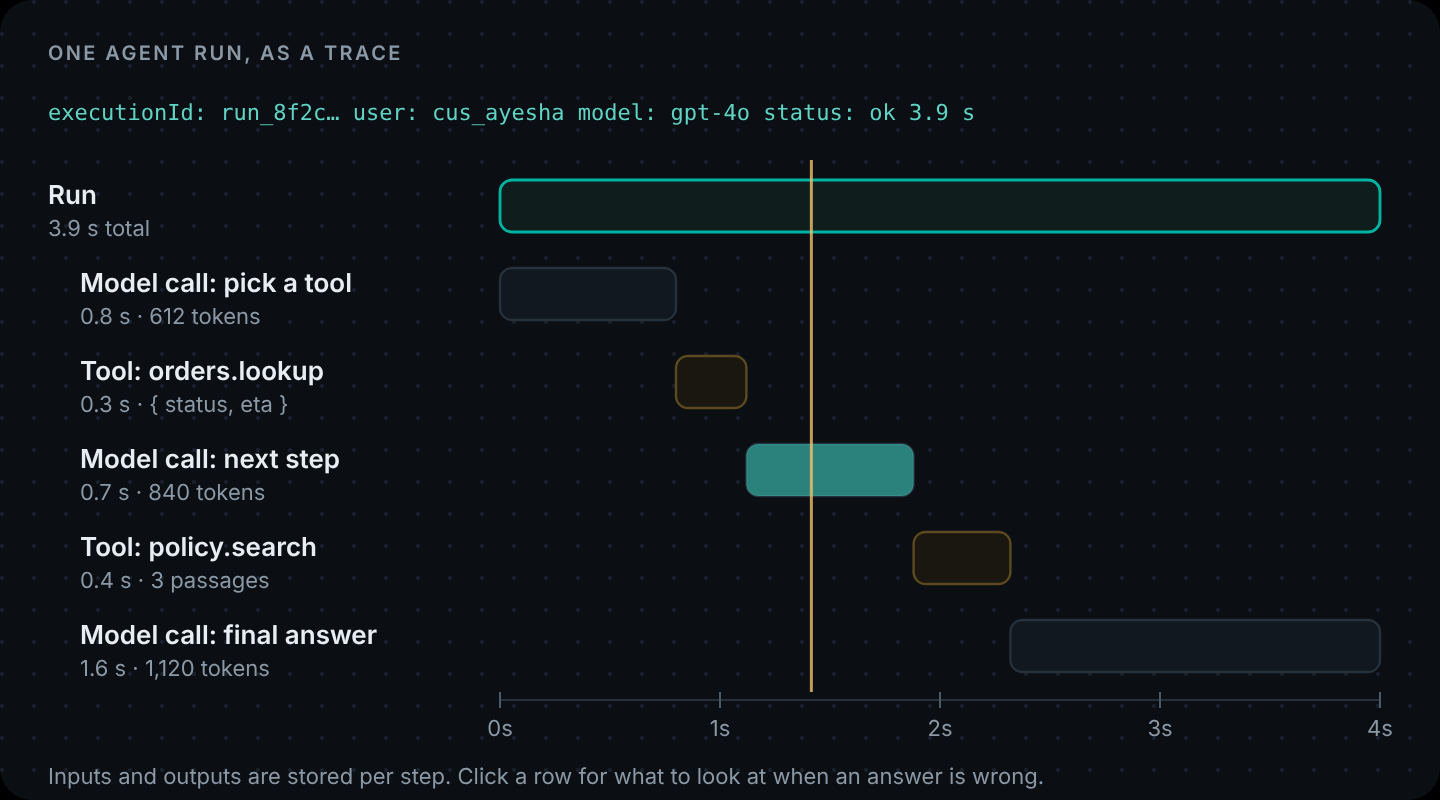
An AI agent that answers wrong doesn't throw an exception. It returns a confident, well-formatted, wrong answer, and the user screenshots it. The only way to fix it is to replay what happened: what the model was asked, which tools it called with which arguments, what came back, and how long each step took.
That's what AI observability platforms are for. (Where tracing fits in the overall design of an agent app is covered in AI Agent Architecture.) This guide compares the main options, including where our own built-in tracing stops.
What an AI agent trace shows
What an AI observability platform records
Traditional monitoring tells you a request took 4 seconds and returned 200. LLM observability needs to tell you why the answer was what it was. The useful records are:
- Traces and spans. One trace per request, with a span for every model call, tool call, retrieval and sub-agent.
- Inputs and outputs per step. The actual prompt, the tool arguments, the tool result, the completion.
- Tokens, latency and cost. Per step and per trace, so you can find the expensive part.
- Metadata. Which user, which session, which model and prompt version.
- Evaluations. Scores on outputs, from automated checks, an LLM judge or human review, run on datasets or on live traffic.
- Monitoring. Dashboards and alerts on error rates, latency, cost and evaluation scores over time.
The first four are tracing. The last two are what separate a full platform from a log viewer.
LangSmith
LangSmith is LangChain's commercial platform, and it's the market leader for teams on LangChain and LangGraph. It covers the whole loop: tracing, datasets and evaluations, prompt management, monitoring and alerts. It works with any stack through its SDK and OpenTelemetry, but the deepest integration is with LangChain, where tracing is a couple of environment variables.
Pricing (checked November 2026): a free Developer plan (1 seat, 5,000 base traces a month), Plus at $39 per seat per month with 10,000 base traces included, and custom Enterprise pricing. Usage beyond the included traces is pay-as-you-go. Base traces are kept for 14 days; extended traces, at extra cost, for 180 days. Self-hosting is available on Enterprise.
Pick it if you build on LangChain or LangGraph, you want evaluations and prompt management in the same tool as traces, and a hosted SaaS is fine for your data.
Langfuse
Langfuse is one of the most widely used open-source LLM observability platforms. The core is MIT-licensed and free to self-host with all core features, on Docker Compose, Kubernetes or the major clouds. It does tracing, evaluations (including LLM-as-a-judge and human annotation), prompt management, datasets and dashboards, and it's built on OpenTelemetry, so it isn't tied to one framework. Langfuse is now part of ClickHouse.
Pricing (checked November 2026): Langfuse Cloud has a free Hobby plan (50,000 units a month, 30 days of data access), Core at $29 a month and Pro at $199 a month (both with 100,000 units, then $8 per 100,000 units; 90 days and 3 years of data access respectively), and Enterprise from $2,499 a month. Self-hosting the open-source version costs only your infrastructure.
Pick it if you want to own your observability data, need to self-host for compliance, or use several frameworks and don't want to be tied to one vendor's tracing.
Langfuse vs LangChain (and LangSmith)
This comparison comes up because the names get mixed together. LangChain is a framework for building agents. LangSmith is LangChain's observability and evaluation platform. Langfuse is an independent observability platform that also works with LangChain, through a callback handler. So the real question is usually Langfuse vs LangSmith for a LangChain app:
| LangSmith | Langfuse | |
|---|---|---|
| Made by | LangChain | Langfuse (part of ClickHouse) |
| License | Commercial | MIT open source core |
| Self-hosting | Enterprise plan | Free, all core features |
| LangChain integration | Native, env vars | Callback handler |
| Other frameworks | SDK + OpenTelemetry | OpenTelemetry-based, many integrations |
| Evaluations | Yes, deep | Yes |
| Prompt management | Yes | Yes |
| Free tier | 5k base traces/month, 1 seat | 50k units/month (Cloud), or self-host |
Other names you'll see on "Langfuse alternatives" lists include Arize Phoenix, Helicone and Datadog's LLM Observability. They're worth a look if you already use the parent company's tools.
Built-in tracing in your agent platform
The third option is the one most comparisons skip: tracing that comes with the platform your agents already run on. On DNotifier, turning it on is one flag:
const agent = DNotifier.defineAgent({
  name: "order-help",
  instructions: "Help customers with their orders. Use the tools for facts.",
  provider: "open_ai",
  model: "gpt-4o",
  observability: true, // every run is recorded
  tools: [lookupOrder, searchPolicy],
  permissions: { "orders.lookup": ["execute"], "policy.search": ["execute"] },
});

const result = await notifier.runAgent(agent, { input, userId, maxToolRounds: 5 });
console.log(result.executionId); // open this run in the dashboard
For multi-agent workflows it's the same flag on the workflow, and you can turn on session logs for every model call on the client. The multi-agent workflow tutorial walks through a traced router example end to end:
const notifier = new DNotifier({
  appId: process.env.DNOTIFIER_APP_ID,
  secret: process.env.DNOTIFIER_SECRET,
  transport: "http",
  userId: "support-api",
  logs: true, // session logs for each AI call, under Logs in the dashboard
});

const workflow = new DNotifier.Workflow({
  name: "support-router",
  observability: true, // each execution under Workflows in the dashboard
  async entry(ctx) {
    const { intent } = await ctx.runAgent("intent-agent", { input: ctx.input });
    ctx.recordStep({ label: "Route", output: { intent } }); // your own labelled step
    return ctx.runAgent(intent === "order" ? "order-help" : "policy-agent", { input: ctx.input });
  },
});
What gets recorded: the run's status and duration, each agent as a node, each AI step with its latency, the provider and model, and tokens when the provider returns them, plus knowledge-base searches and any custom steps you add with ctx.recordStep().
Where it stops, to be straight about it: DNotifier doesn't have an evaluations product, dataset management or alerting on quality scores today. It's tracing included with your agent platform, not a LangSmith replacement. If you need evals, run them in a dedicated tool alongside it.
Pick it if your agents run on DNotifier and you want every run traced from day one, with no second vendor to set up. The full list of what's included is on the features page.
How to trace AI agent runs in production
Include authorization decisions in the trace as well as successful actions. See logging calls and denials for the permissions side of the audit trail.
Whichever tool you pick, the same practices make traces useful.
Log the run ID next to the request
This is also on the checklist in How to Deploy AI Agents to Production.
Put the trace or execution ID in your own application logs, next to the HTTP request and the user ID. When support forwards a complaint, you search your logs for the user and land on the exact trace in one click.
logger.info({ userId: req.user.id, executionId: result.executionId, route: "/api/agent" }, "agent run");Decide what never goes into a trace
Traces hold prompts and tool results, and those can contain personal data. Before you turn tracing on everywhere:
- Have tools return only the fields the model needs (an order's status, not the customer's full address).
- Don't put secrets, tokens or payment data in prompts or tool results at all.
- Check each platform's retention and deletion options against your privacy policy.
Label steps for the person debugging later
"AI step 3" helps nobody. "Classify intent" and "Search refund policy" do. In DNotifier that's the label on ctx.sendAI and ctx.search, and ctx.recordStep() for code decisions.
Review a sample every week
The most useful observability habit costs nothing: read twenty real traces a week. You'll find the wrong tool choices, the slow steps and the prompts that need work long before a dashboard does.
AI agent monitoring: the signals that matter
Tracing tells you about one run. Monitoring tells you about all of them. The handful of signals worth watching from the start:
| Signal | Why it matters |
|---|---|
| Runs that hit the step limit | The agent was confused or a tool kept failing |
| Tool error rate per tool | A broken integration shows up here first |
| p95 latency per agent | Users notice the slow tail, not the average |
| Tokens per run | Cost creep from longer prompts or extra tool rounds |
| Hand-offs to a human | Questions the agent can't answer yet |
Which AI observability platform should you choose?
- Building on LangChain or LangGraph, want everything in one place: LangSmith.
- Want open source and to own the data, or need self-hosting: Langfuse.
- Agents run on DNotifier and you need tracing now: start with the built-in tracing. Add Langfuse or LangSmith when you need evaluations and datasets.
- Already deep in a monitoring vendor: check its LLM observability add-on before adding another tool.
Every agent run traced from the first one: steps, tools, latency and the model used. Turn on
observability: true. Tracing on the features page · Create your app
FAQ
What is the best AI observability platform?
For LangChain and LangGraph users, LangSmith is the most complete: tracing, evaluations, prompt management and monitoring in one product. Langfuse is the leading open-source choice and is free to self-host. If your agents run on a platform with built-in tracing, start there and add an evals tool when you need it.
What are the best Langfuse alternatives for LangChain apps?
LangSmith is the most direct alternative, with native LangChain integration. Arize Phoenix and Helicone are other common options, and teams already using Datadog can look at its LLM Observability product.
What is the difference between Langfuse and LangSmith?
LangSmith is LangChain's commercial platform with native LangChain tracing and deep evaluation features; self-hosting is an Enterprise option. Langfuse is an independent, MIT-licensed open-source platform that is free to self-host and works with LangChain through a callback handler.
Is LangChain the same as LangSmith?
No. LangChain is an open-source framework for building LLM applications and agents. LangSmith is LangChain's separate commercial platform for tracing, evaluating and monitoring them.
How do I trace AI agent runs in production?
Turn on tracing in your agent framework or platform, record the trace or execution ID next to each request in your own logs, label each step clearly, keep personal data and secrets out of prompts and tool results, and review a sample of real traces every week.
Does DNotifier include AI observability?
Yes, for tracing. With observability: true on an agent or workflow, each run is recorded with its agents, AI steps, latency, model and searches, and session logs record each AI call. DNotifier doesn't currently offer evaluations or datasets, so pair it with a dedicated tool for those.